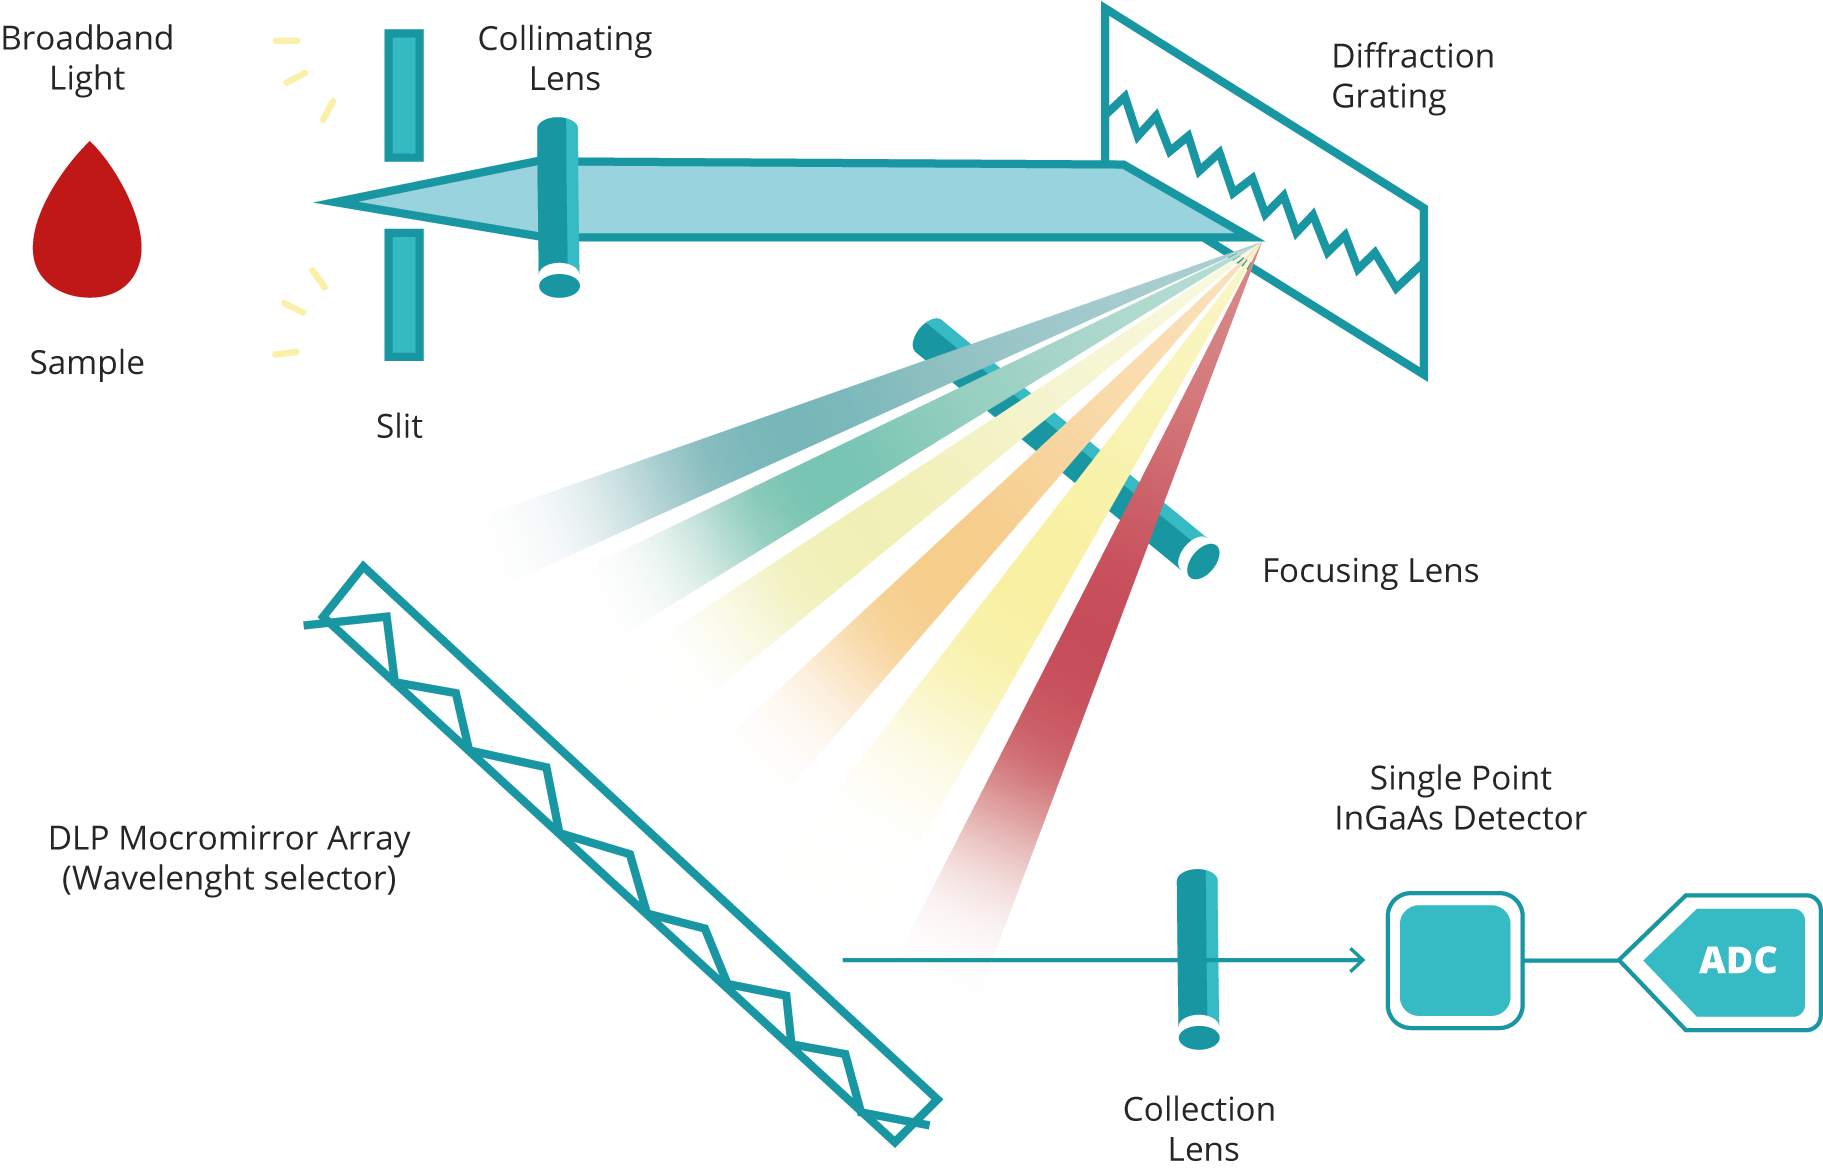
Hemospec analyses whole blood through its optical signature. The system measures how the sample absorbs light across a defined spectral range. That absorption pattern carries information on the molecular composition of the sample and is used to estimate clinically relevant parameters.
In practice, the sensor captures the optical reading, and the analytical layer processes that signal using cloud-based models. The aim is to extract useful information from the spectral pattern of the sample and translate it into a structured result set. This is why the system combines photonics, software and analytical modelling in a single architecture.
Why?
This approach makes it possible to work with a small blood sample, avoid reagent-heavy handling and bring a broader panel of biomarkers closer to the point of care. In the current product framing, that includes hematological parameters together with C-reactive protein, expanding the system beyond single-analyte testing.
Validation and performance
Performance characteristics, including sensitivity, specificity and accuracy, are established against reference laboratory methods for each analyte, within a defined and validated working range. Validated performance differs by analyte: the haematological panel is supported by a quantitative validated range, while C-reactive protein is reported as a threshold classifier, to be interpreted together with clinical judgement.
Performance Profile
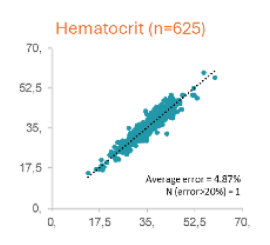
Hematocrit
MARD around 9%, with accuracy ranging from 84% to 87%
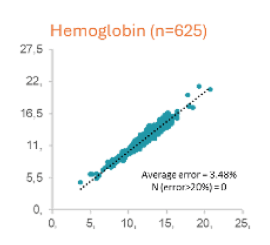
Hemoglobin
MARD around 8–10%, with accuracy ranging from 82% to 94%
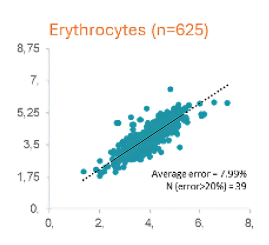
RBC
MARD around 10–11%, with accuracy ranging from 76% to 80%
CRP
Classification accuracy around 73% to 80% in validated units
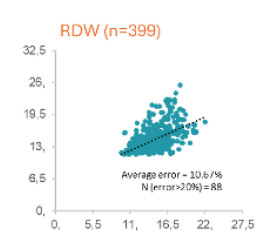
RDW
MARD around 10–13%, with accuracy ranging from 61% to 63%
Hematocrit
MARD around 9%, with
accuracy ranging from 84% to
87%
Hemoglobin
MARD around 8–10%, with
accuracy ranging from 82% to
94%
RBC
MARD around 10–11%, with
accuracy ranging from 76%
to 80%
CRP
Classification accuracy around
73% to 80% in validated units
RDW
MARD around 10–13%, with
accuracy ranging from 61% to
63%
Certifications
Ongoing and research
An expanding analytical platform
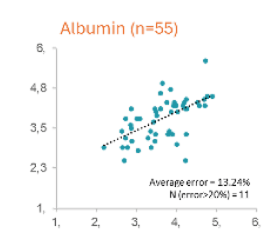
Hemospec continues to evolve as an analytical platform. Current work includes the expansion of the biomarker panel through targeted optical development in creatinine, total proteins, albumin, and additional work around glucose and lactate.
Glucose Non-invasive measurement
Labinlight is advancing non-invasive glucose measurement through transdermal optical analysis, combining dedicated optical configurations with analytical models developed for this new mode of sensing.
Non-targeted analysis
A second research direction is non-targeted analysis, where the full spectral signature is used to identify clinically meaningful patterns rather than focusing on a single biomarker alone. This approach opens the platform to broader analytical models associated with complex conditions, including sepsis, chronic kidney disease, iron-deficiency anaemia and prognostic stratification. Internal research materials already describe encouraging model performance across several of these exploratory paths.